Output
Output Structure
epigeneticbutton/
├── config/                     # Location for the main config file and recommended location for sample files and target files
├── data/                       # Location for test material and examples (e.g. zm_structural_RNAs.fa.gz)
├── Help/                       # Location for help files (e.g. Help_structural_RNAs_database_with_Rfam)
├── profiles/
│       ├── sge/                # Config file to run snakemake on a cluster managed by SGE
│       └── slurm/              # Config file to run snakemake on a cluster managed by SLURM
├── workflow/
│       ├── envs/               # Conda environment file for depencies
│       ├── rules/              # Snakemake files with data type analysis rules
│       ├── scripts/            # R scripts for plots
│       └── snakefile           # main snakefile
├── genomes/                    # Genome directories created upon run
│       └── {ref_genome}/       # Reference genome directories with sequence, annotation and indexes
└── results/                    # Results directories created upon run
        ├── combined/           # Combined analysis results
        │       ├── bedfiles/   # Peak calling results
        │       ├── chkpts/     # Empty checkpoint files used for pipeline logic. Deleting them will trigger rerunning the corresponding analysis
        │       ├── logs/       # Log files
        │       ├── matrix/     # Data matrices
        │       ├── plots/      # Visualization plots
        │       └── reports/    # Analysis reports
        └── <env>/      # Data type specific directories
                ├── chkpts/     # Empty checkpoint files used for pipeline logic. Deleting them will trigger rerunning the corresponding analysis
                ├── fastq/      # Processed FASTQ files
                ├── logs/       # Log files
                ├── mapped/     # Mapped reads (bam)
                ├── plots/      # Data type specific plots
                ├── reports/    # QC reports
                ├── tracks/     # Track files (bigwigs)
                └── */          # data-specific directories (e.g. 'peaks' for ChIP, 'peaks' and 'motifs' for TF, 'DEG' for RNA, 'DMRs' and 'methylcall' for mC, 'clusters' for sRNA)
Histone ChIP-seq
Output tree
ChIP/
├── chkpts/     # Empty checkpoint files used for pipeline logic. Deleting them will trigger rerunning the corresponding analysis
├── fastq/      # Processed FASTQ files
├── logs/       # Log files
├── mapped/     # Mapped reads (bam)
├── peaks/      # Peak files (MACS2 output) for each replicate, pseudo-replicate and merged biological replicates and selected peaks (shared by merged and both pseudo-replicates).
├── plots/      # Fingerprints (IP vs Input for each IP sample), IDR if at least two biological replicates
├── reports/    # QC reports (output from Cutadapt) and summary of mapping statistics and peak statistics (output from Bowtie2 and samtools)
└── tracks/     # Track files (bigwigs); log2FC of IP/Input for each rep and merged if at least 2 biological replicates
Mapping metrics
Data for each sample:
results/ChIP/reports/summary_ChIP_<paired>_mapping_stats_ChIP__<line>__<tissue>__<sample_type>__<replicate>__<ref_genome>.txt
Summary table:
results/combined/reports/summary_mapping_stats_<analysis_name>_ChIP.txt
Plot:
results/combined/plots/mapping_stats_<analysis_name>_ChIP.pdf
Example:
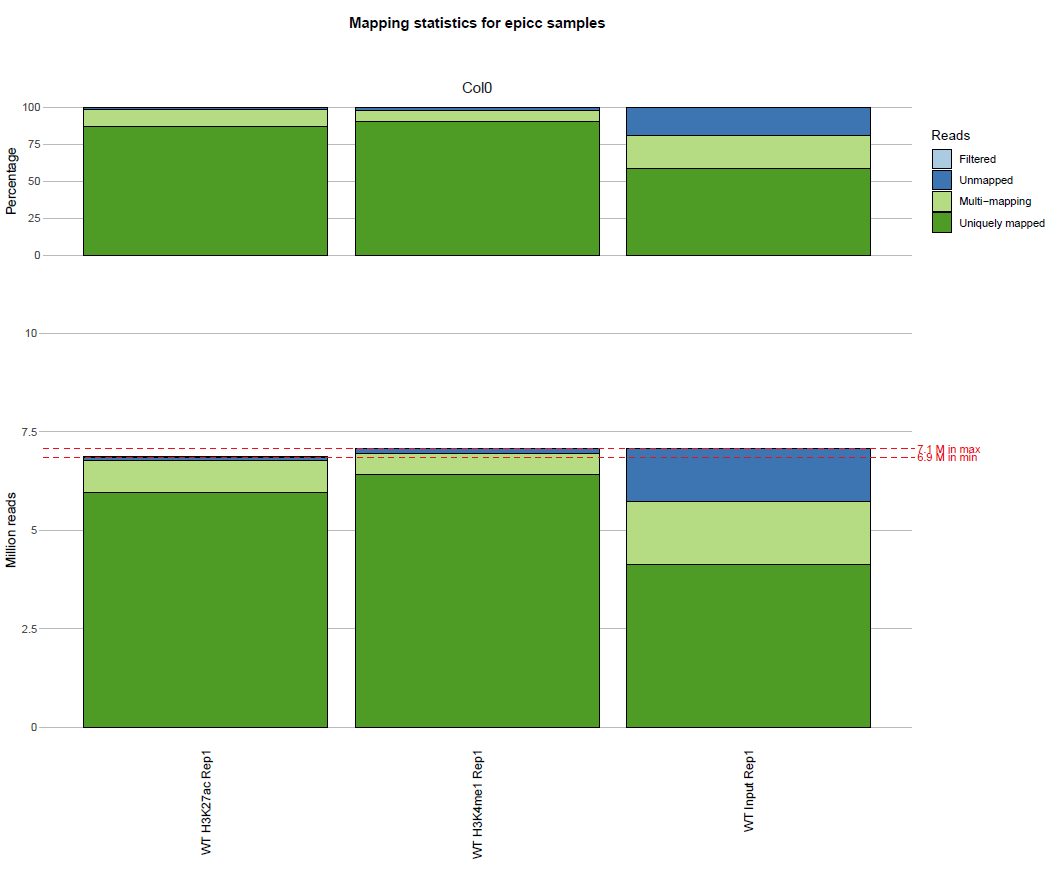
Histogram of mapping metrics
(the actual output is in pdf format)
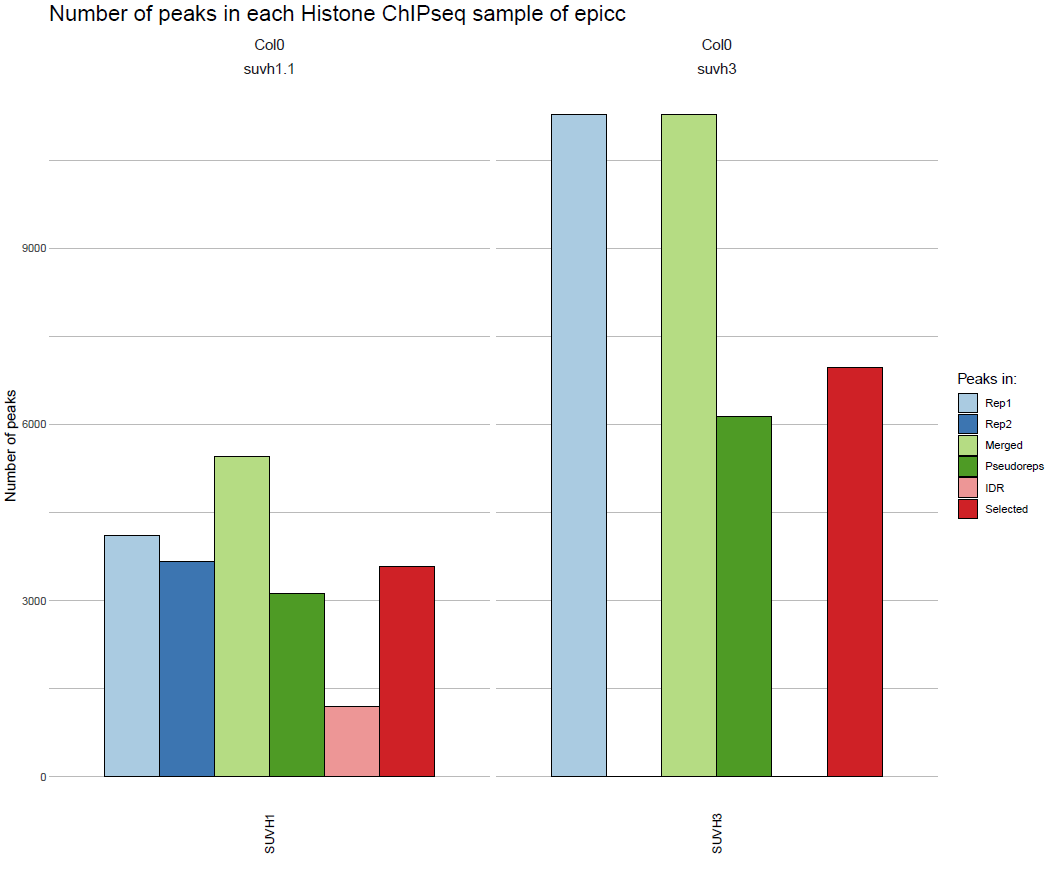
Peak metrics
Data for each sample:
results/ChIP/reports/summary_ChIP_peak_stats_ChIP__<line>__<tissue>__<sample_type>__<ref_genome>.txt
Summary table:
results/combined/reports/summary_peak_stats_<analysis_name>_ChIP.txt
Plot:
results/combined/plots/peak_stats_<analysis_name>_ChIP.pdf
(see TF ChIP-seq for an example)
Fingerprints
Performed with Deeptools.
Plot for each biological replicate:
results/ChIP/plots/Fingerprint__final__<data_type>__<line>__<tissue>__<sample_type>__<replicate>__<ref_genome>.png
(see TF ChIP-seq for an example)
IDR
Performed with IDR.
Plot for pairs of biological replicate:
results/ChIP/plots/idr_<paired>__<data_type>__<line>__<tissue>__<sample_type>__<replicate1>_vs_<replicate2>__<ref_genome>.<narrow|broad>Peak.png
(see TF ChIP-seq for an example)
Upset Plot
Perfomed with ComplexUpset.
Table of combined peaks for all histone ChIP-seq samples in the analysis:
results/combined/bedfiles/combined_peaks__ChIP__<analysis_name>__<ref_genome>.bed
Table of combined peaks for all histone ChIP-seq samples in the analysis annotated based on the closest gene:
results/combined/bedfiles/annotated__combined_peaks__ChIP__<analysis_name>__<ref_genome>.bed
Upset plot:
results/combined/plots/Upset_combined_peaks__ChIP__<analysis_name>__<ref_genome>.pdf
(see Combined Output for an example)
TF ChIP-seq
Output tree
TF/
├── chkpts/     # Empty checkpoint files used for pipeline logic. Deleting them will trigger rerunning the corresponding analysis
├── fastq/      # Processed FASTQ files
├── logs/       # Log files
├── mapped/     # Mapped reads (bam)
├── motifs/     # Motifs analysis with the MEME suite, one folder per selected and idr peaks (and per replicates if so chosen in the config file)
├── peaks/      # Peak files (MACS2 output) for each replicate, pseudo-replicate and merged biological replicates and selected peaks (shared by merged and both pseudo-replicates).
├── plots/      # Fingerprints (IP vs Input for each IP sample), IDR if at least two biological replicates
├── reports/    # QC reports (output from Cutadapt) and summary of mapping statistics and peak statistics (output from Bowtie2 and samtools)
└── tracks/     # Track files (bigwigs); log2FC of IP/Input for each rep and merged if at least 2 biological replicates
Mapping metrics
Data for each sample:
results/TF/reports/summary_TF_<paired>_mapping_stats_<data_type>__<line>__<tissue>__<sample_type>__<replicate>__<ref_genome>.txt
Summary table:
results/combined/reports/summary_mapping_stats_<analysis_name>_TF.txt
Plot:
results/combined/plots/mapping_stats_<analysis_name>_TF.pdf
(see histone ChIP-seq for an example)
Peak metrics
Data for each sample:
results/TF/reports/summary_TF_peak_stats_<dat_type>__<line>__<tissue>__<sample_type>__<ref_genome>.txt
Summary table:
results/combined/reports/summary_peak_stats_<analysis_name>_TF.txt
Plot:
results/combined/plots/peak_stats_<analysis_name>_TF.pdf
Example:
Histogram of peak metrics
(the actual output is in pdf format)
Fingerprints
Performed with Deeptools.
Plot for each biological replicate:
results/ChIP/plots/Fingerprint__final__<data_type>__<line>__<tissue>__<sample_type>__<replicate>__<ref_genome>.png
Example:
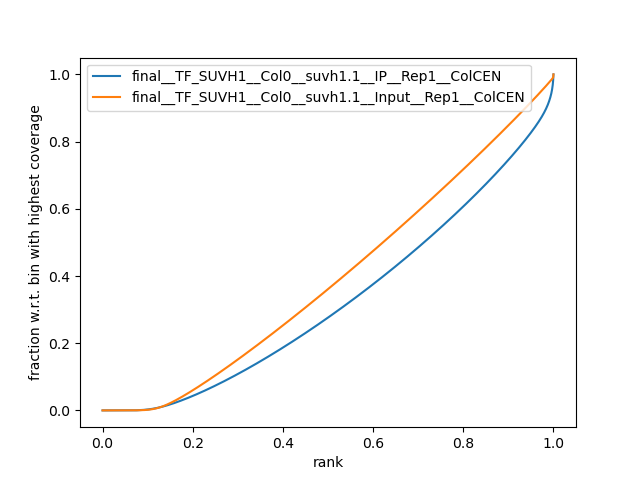
Fingerprint plot comparing an IP to its Input
Irreproducible Discovery Rate
Performed with IDR.
Plot for pairs of biological replicates:
results/ChIP/plots/idr_<paired>__<data_type>__<line>__<tissue>__<sample_type>__<replicate1>_vs_<replicate2>__<ref_genome>.<narrow|broad>Peak.png
Example:
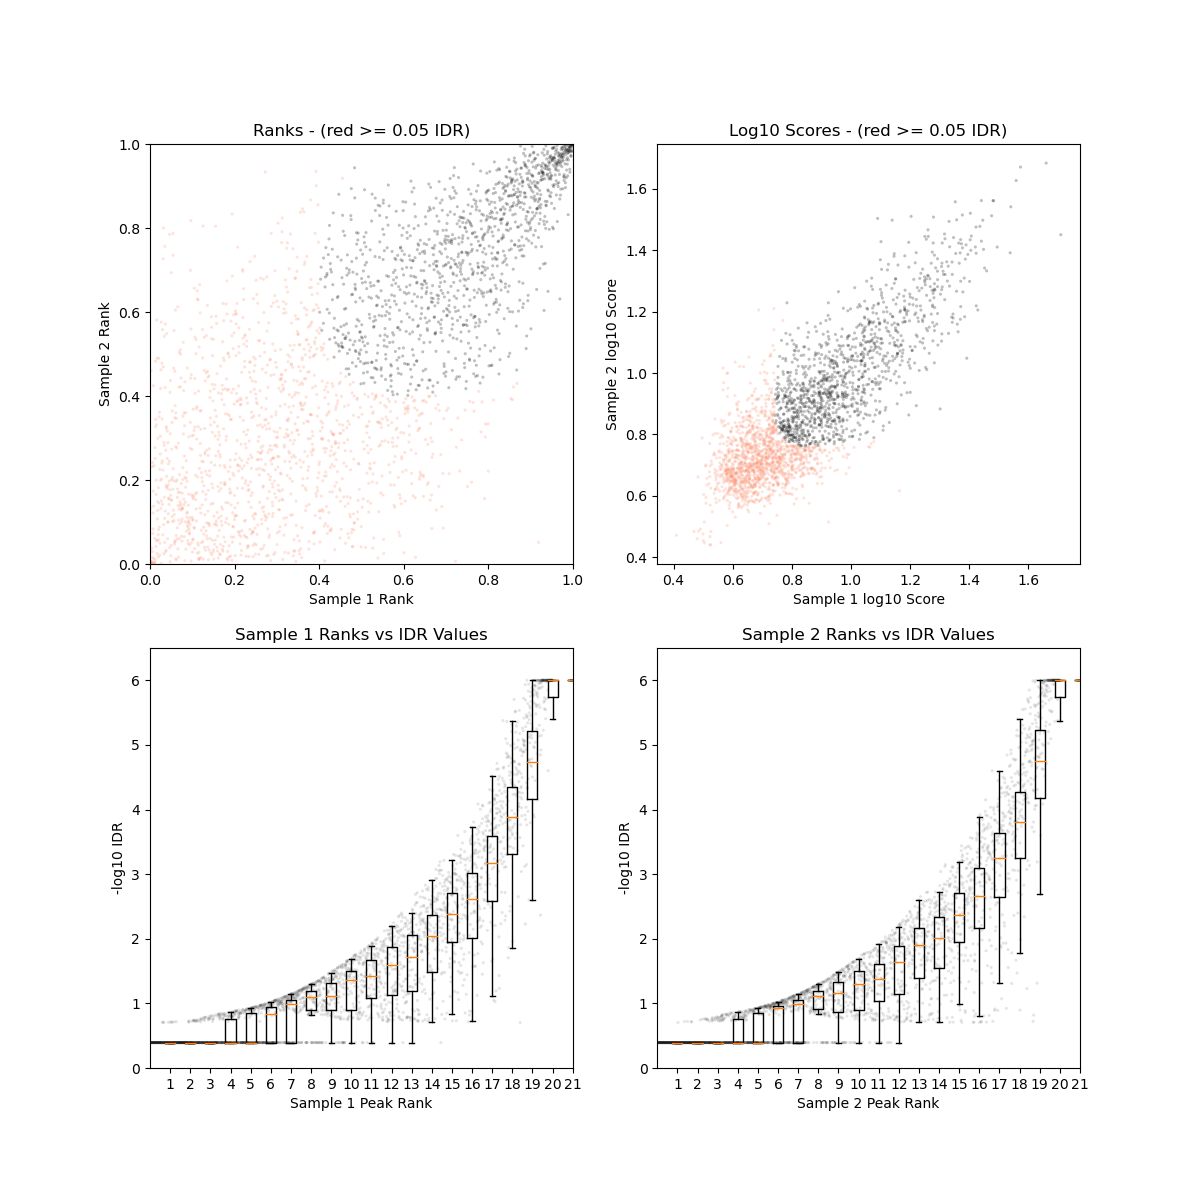
Plot of Irreproducible Discovery Rate for two biological replicates
Motifs
Performed with the MEME suite.
Full output from selected peaks (and idr peaks if available) for each sample:
results/TF/motifs/selected_peaks__<data_type>__<line>__<tissue>__<sample_type>__<ref_genome>/meme/
which includes:
results/TF/motifs/selected_peaks__<data_type>__<line>__<tissue>__<sample_type>__<ref_genome>/meme/meme_out/meme.html
Example:
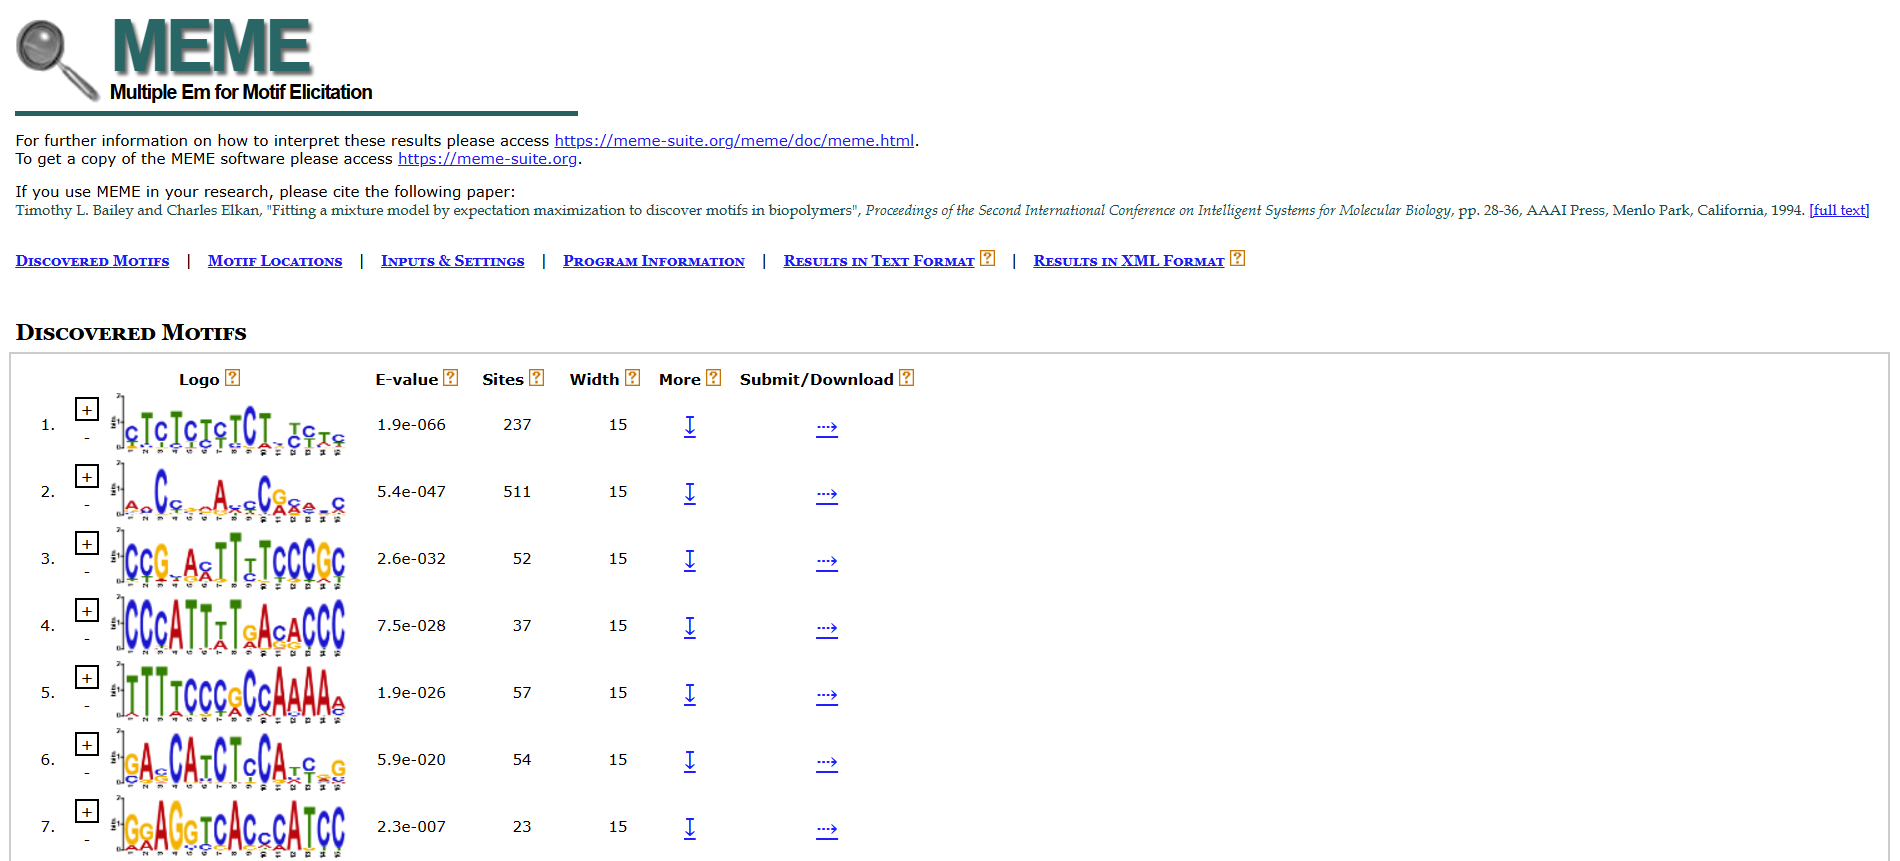
Screenshot of HMTL output from meme
(the actual output is in html format, and others)
Upset Plot
Perfomed with ComplexUpset.
Table of combined peaks for all TF ChIP-seq samples in the analysis:
results/combined/bedfiles/combined_peaks__TF__<analysis_name>__<ref_genome>.bed
Table of combined peaks for all TF ChIP-seq samples in the analysis annotated based on the closest gene:
results/combined/bedfiles/annotated__combined_peaks__TF__<analysis_name>__<ref_genome>.bed
Upset plot:
results/combined/plots/Upset_combined_peaks__TF__<analysis_name>__<ref_genome>.pdf
(see Combined Output for an example)
RNA-seq
Output tree
RNA/
├── chkpts/     # Empty checkpoint files used for pipeline logic. Deleting them will trigger rerunning the corresponding analysis
├── DEG/ # Differential Expression Analysis results. Contains count tables, list of differential expression genes for all pairwise comparisons, gene expression tables and RData object for plotting gene expression (see `usage - plotting differential expression`)
├── fastq/      # Processed FASTQ files
├── GO/ # Gene Ontology Analysis results (optional). Contains GO terms enriched in sets of DEGs uniquely UP- or DOWN-regulated in each sample, and in additional GO analysis (see `usage - GO analysis`)
├── logs/       # Log files
├── mapped/     # Mapped reads (bam) (and STAR output files)
├── plots/      # Expression and GO analysis (optional)
├── reports/    # QC reports (output from Cutadapt) and summary of mapping statistics and peak statistics (output from STAR and samtools)
└── tracks/     # Track files (bigwigs); plus and minus strand (still in positive values) CPM for each replicate and merged all replicates per sample
Mapping metrics
Data for each sample:
results/RNA/reports/summary_RNA_<paired>_mapping_stats_<data_type>__<line>__<tissue>__<sample_type>__<replicate>__<ref_genome>.txt
Summary table:
results/combined/reports/summary_mapping_stats_<analysis_name>_RNA.txt
Plot:
results/combined/plots/mapping_stats_<analysis_name>_RNA.pdf
(see histone ChIP-seq for an example)
Differential Expression analysis
Counts from STAR; analysis performed with EdgeR.
Count data for each RNAseq sample:
results/RNA/DEG/counts__<data_type>__<line>__<tissue>__<sample_type>__<replicate>__<ref_genome>.tab
Summary tables for all RNAseq samples used for the analysis:
results/RNA/DEG/counts__<analysis_name>__<ref_genome>.txt # Count data output by STAR
results/RNA/DEG/samples__<analysis_name>__<ref_genome>.txt # Table of samples information for edgeR analysis
results/RNA/DEG/genes_rpkm__<analysis_name>__<ref_genome>.txt # Table of gene expression values for all genes in all samples in Reads per Kilobase Million (RPKM)
Output tables of differentially expressed genes (DEG) for each pairwise comparison:
results/RNA/DEG/FC_<analysis_name>__<ref_genome>__<line_sample1>__<tissue_sample1>_vs_<line_sample2>__<tissue_sample2>.txt # all genes in logFC sample1/sample2 and their differential statistics
results/RNA/DEG/DEG_<analysis_name>__<ref_genome>__<line_sample1>__<tissue_sample1>_vs_<line_sample2>__<tissue_sample2>.txt # only DEGs
Output summary tables of DEGs for all pairwise comparisons:
results/RNA/DEG/summary_DEG_stats__<analysis_name>__<ref_genome>.txt # number of differential expressed genes in all pairwise comparisons and uniquely regulated in each sample
results/RNA/DEG/unique_DEGs__<analysis_name>__<ref_genome>.txt # list of genes uniquely regulated in each sample
Rdata object for plotting expression levels:
results/RNA/DEG/ReadyToPlot__<analysis_name>__<ref_genome>.RData
Global output from the differential analysis:
results/combined/plots/BCV_RNAseq_<analysis_name>_<ref_genome>.pdf # Biological Coefficient of Variation of all genes
results/combined/plots/MDS_RNAseq_<analysis_name>_<ref_genome>_d12.pdf # Multidimensional scaling of all the samples on the first two dimensions, with dots instead of labels
results/combined/plots/MDS_RNAseq_<analysis_name>_<ref_genome>_d12_labs.pdf # Multidimensional scaling of all the samples on the first two dimensions, with labels instead of dots
results/combined/plots/MDS_RNAseq_<analysis_name>_<ref_genome>_d23.pdf # Multidimensional scaling of all the samples on the first two dimensions, with dots instead of labels
results/combined/plots/MDS_RNAseq_<analysis_name>_<ref_genome>_d23_labs.pdf # Multidimensional scaling of all the samples on the first two dimensions, with labels instead of dots
Examples:
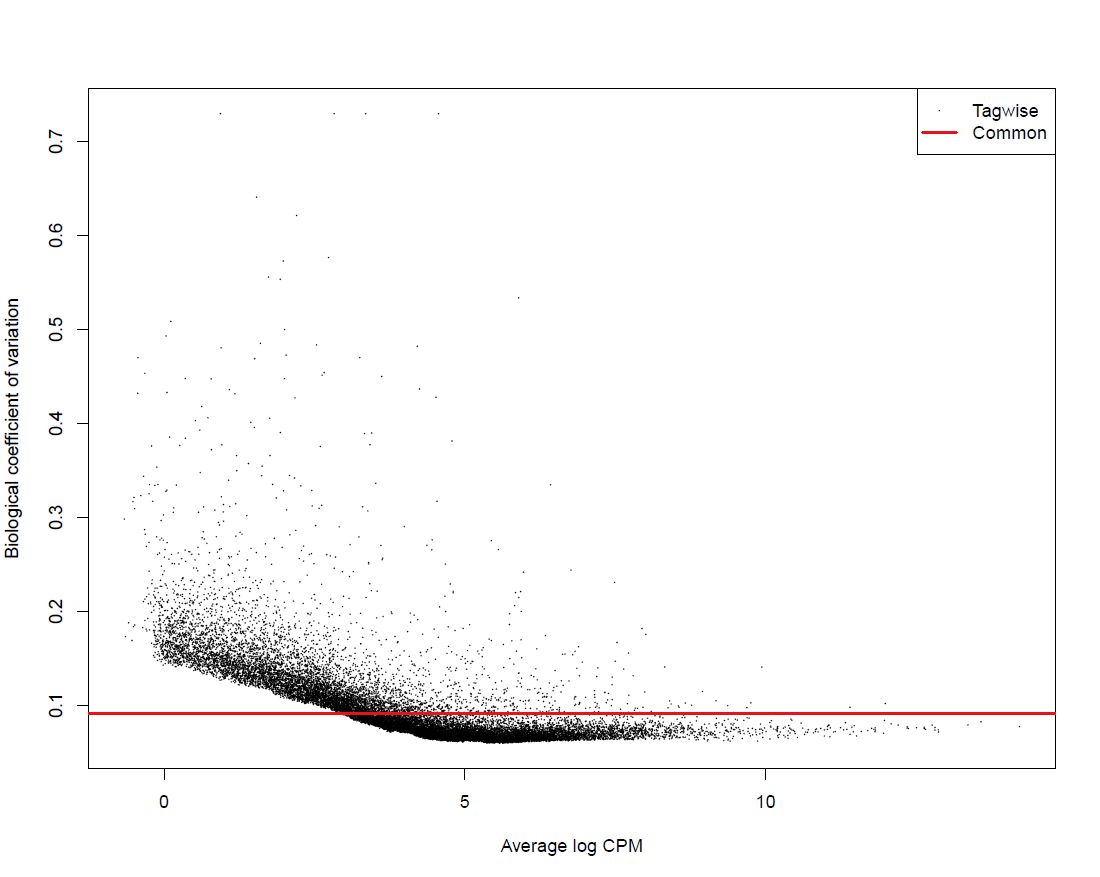
BCV plot for all genes
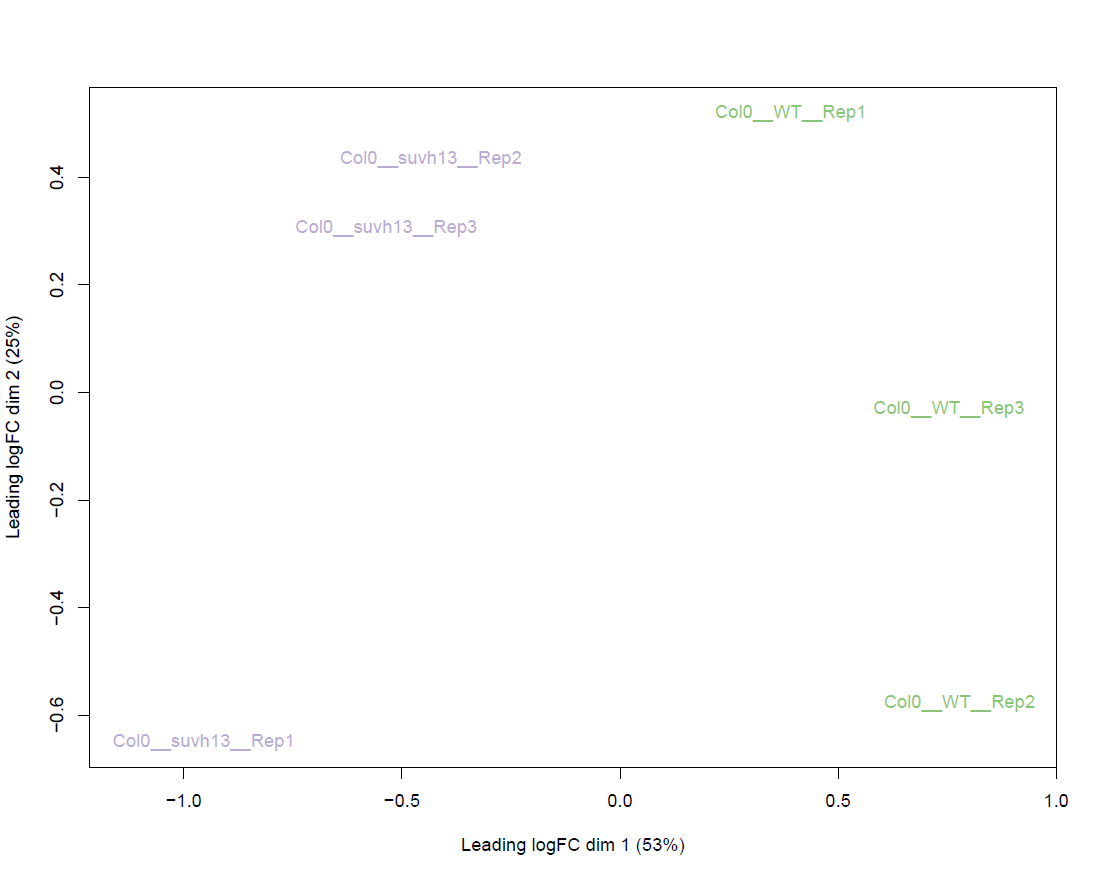
MDS plot for all RNA-seq samples
Heatmap of all DEGs across all samples:
results/combined/plots/Heatmap_RNAseq_cpm__<analysis_name>__<ref_genome>.pdf # all gene expression normalized by count per million
results/combined/plots/Heatmap_RNAseq_zscore__<analysis_name>__<ref_genome>.pdf # each gene normalized by Z-score
Example:
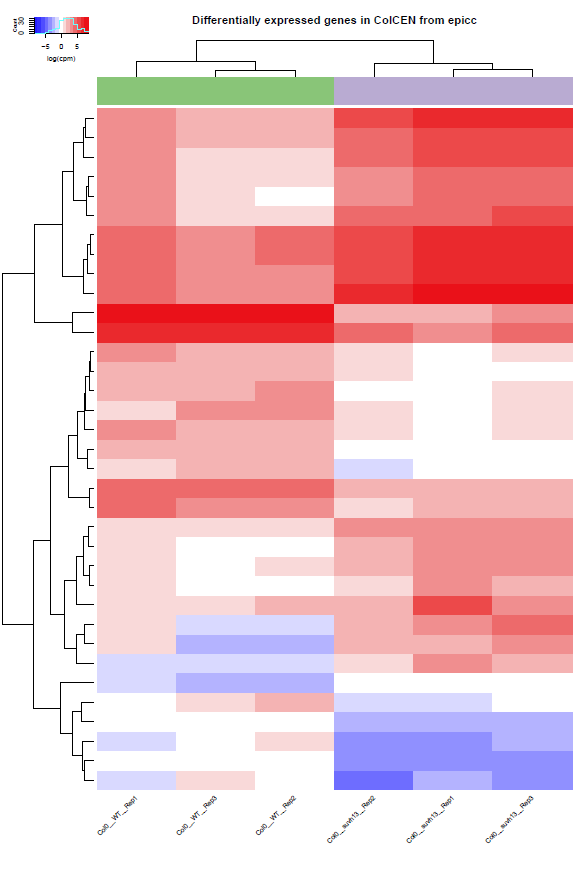
Heatmap of expression (CPM) in all samples for all the differentially expressed genes in this analysis
(the actual output is in pdf format)
Plots of expression level in all samples for the top 100 DEGs (if present):
results/combined/plots/plot_expression__<analysis_name>__<ref_genome>__unique_DEGs.pdf
Example:
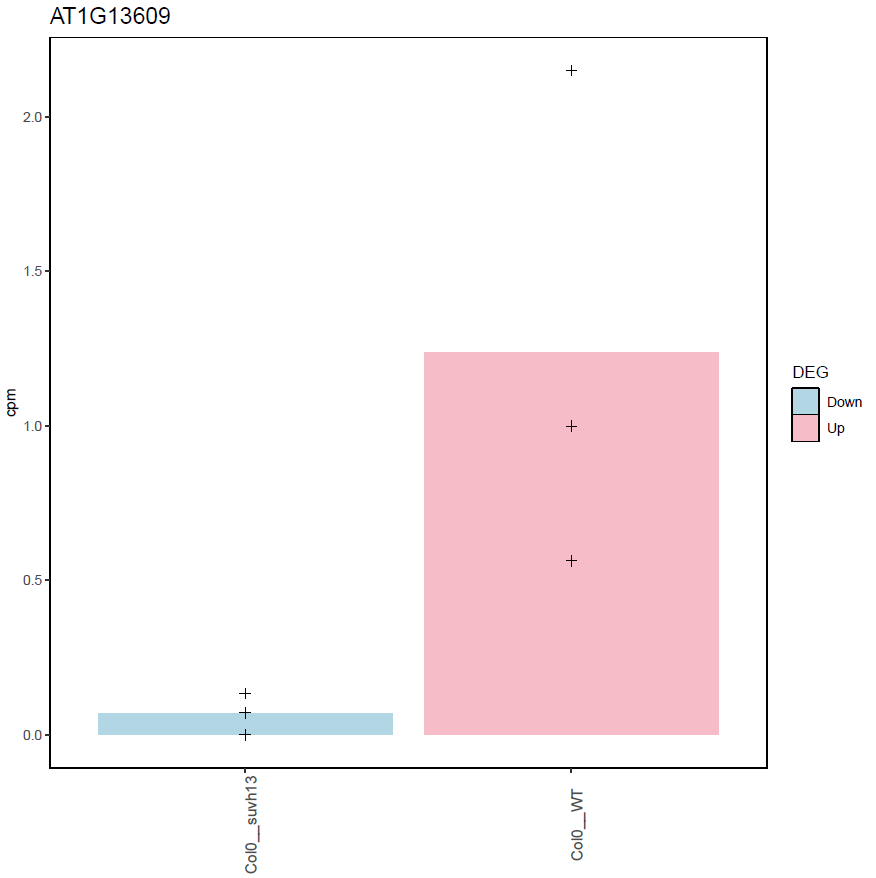
Histogram of gene expression (RPKM) in the different samples (dots = biological replicates, bar = mean) for one differentially expressed gene
Gene Ontology analysis
Performed with rrvgo and TopGO.
List of Gene Ontology (GO) terms and corresponding Gene IDs (GIDs) enriched in the DEGs uniquely UP- and DOWN-regulated in each sample:
results/RNA/GO/topGO_DOWN_in_<line>__<tissue>_BP_GOs.txt # Biological Process (BP) GO terms enriched in genes only DOWN-regulated in this sample
results/RNA/GO/topGO_DOWN_in_<line>__<tissue>_BP_GIDs.txt # genes in the Biological Process (BP) GO terms enriched in genes only DOWN-regulated in this sample
results/RNA/GO/topGO_DOWN_in_<line>__<tissue>_MF_GOs.txt # Molecular Function (MF) GO terms enriched in genes only DOWN-regulated in this sample
results/RNA/GO/topGO_DOWN_in_<line>__<tissue>_MF_GIDs.txt # genes in the Molecular Function (MF) GO terms enriched in genes only DOWN-regulated in this sample
results/RNA/GO/topGO_UP_in_<line>__<tissue>_BP_GOs.txt # Biological Process (BP) GO terms enriched in genes only UP-regulated in this sample
results/RNA/GO/topGO_UP_in_<line>__<tissue>_BP_GIDs.txt # genes in the Biological Process (BP) GO terms enriched in genes only UP-regulated in this sample
results/RNA/GO/topGO_UP_in_<line>__<tissue>_MF_GOs.txt # Molecular Function (MF) GO terms enriched in genes only UP-regulated in this sample
results/RNA/GO/topGO_UP_in_<line>__<tissue>_MF_GIDs.txt # genes in the Molecular Function (MF) GO terms enriched in genes only DOWN-regulated in this sample
Corresponding plots:
results/RNA/plots/topGO_DOWN_in_<line>__<tissue>_BP_treemap.pdf # Treemap of simplified BP terms in DOWN-regulated genes in this sample
results/RNA/plots/topGO_DOWN_in_<line>__<tissue>_MF_treemap.pdf # Treemap of simplified MF terms in DOWN-regulated genes in this sample
results/RNA/plots/topGO_UP_in_<line>__<tissue>_BP_treemap.pdf # Treemap of simplified BP terms in UP-regulated genes in this sample
results/RNA/plots/topGO_UP_in_<line>__<tissue>_MF_treemap.pdf # Treemap of simplified MF terms in UP-regulated genes in this sample
If not enough terms are enriched, these plots might not be created.
Example:
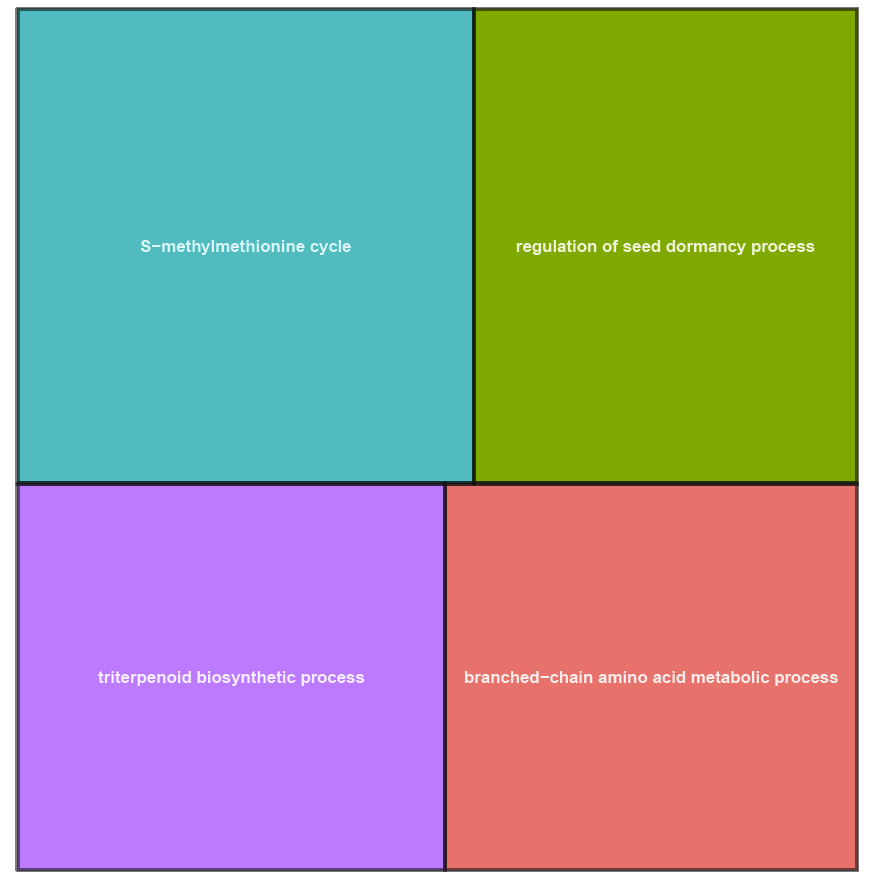
Treemap of the enriched Gene Ontology term of the Biological Process class in unique Down-regulated genes of this sample
(the actual output is in pdf format)
small RNA-seq
Output tree
sRNA/
├── chkpts/     # Empty checkpoint files used for pipeline logic. Deleting them will trigger rerunning the corresponding analysis
├── clusters/ # Clusters and differential analysis when all samples are analyzed together, on de novo identified clusters, on all genes and on all TEs (optional)
├── fastq/      # Processed FASTQ files
├── logs/       # Log files
├── mapped/     # Subfolders of ShortStack output for each replicate
├── reports/    # QC reports (output from Cutadapt) and summary of size statistics
└── tracks/     # Track files (bigwigs); plus and minus strand (still in positive values) CPM for each replicate and merged all replicates per sample for each size chosen (default, 21, 22, 23 and 24nt)
Mapping statistics
Data for each sample:
results/sRNA/reports/sizes_stats__<data_type>__<line>__<tissue>__<sample_type>__<replicate>__<ref_genome>.txt
Summary table:
results/combined/reports/summary_sizes_stats_<analysis_name>_sRNA.txt
Plot:
results/combined/plots/srna_sizes_stats_<analysis_name>_sRNA.pdf # all sizes found in the raw data
results/combined/plots/srna_sizes_stats_zoom_<analysis_name>_sRNA.pdf # zoom to chosen sizes (default 21 to 24nt)
Example:
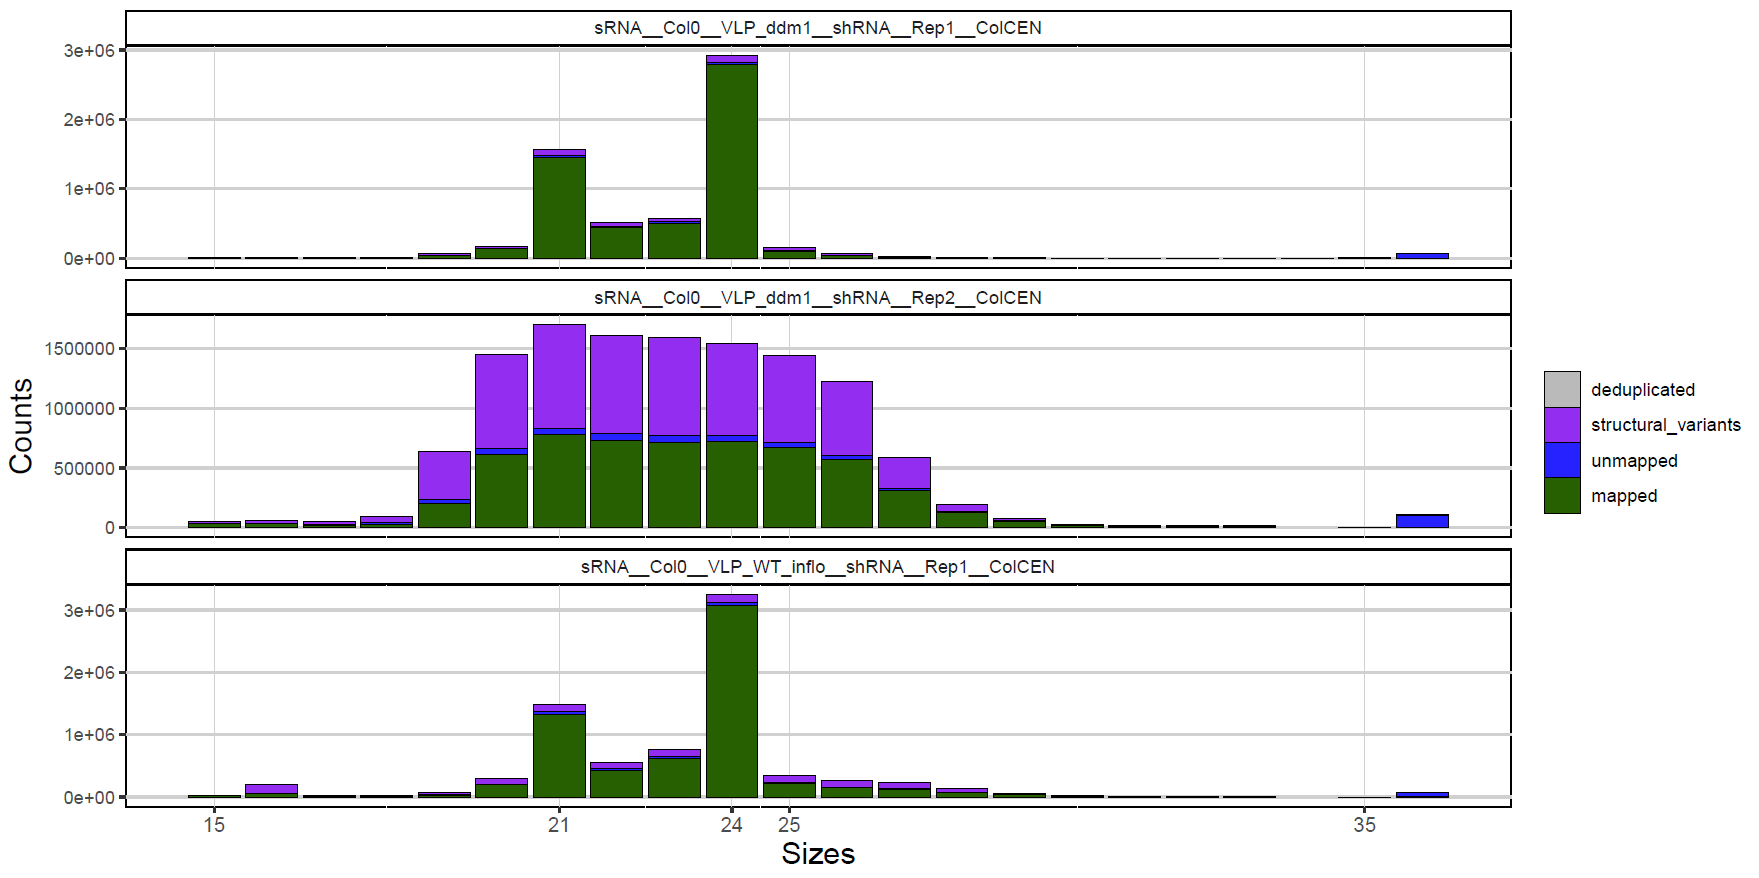
Histogram of size distribution in small RNA samples
Cluster and Differential Expression analysis
Counts from ShortStack; analysis performed with EdgeR.
ShortStack analysis on each replicate:
results/mapped/<data_type>__<line>__<tissue>__<sample_type>__<replicate>__<ref_genome>/ # output folder from ShortStack with all cluster results and alignement files
results/mapped/<data_type>__<line>__<tissue>__<sample_type>__<replicate>__<ref_genome>/clusters.bed # simplified bed-file of clusters for downstream analyses
For all samples in the analysis, two runs will be performed by default (three with the optional TE analysis), which will create the same output
The full ShortStack output will be located in these folders:
results/clusters/<analysis_name>__<ref_genome>__on_new_clusters/ # Identifying small RNA clusters, normalizing accross all samples
results/clusters/<analysis_name>__<ref_genome>__on_all_genes/ # Limiting mapping to all genes, normalizing accross all samples
results/clusters/<analysis_name>__<ref_genome>__on_all_TEs/ # Limiting mapping to all TEs, normalizing accross all samples (optional)
Each folder (e.g. on new clusters) will also contain the files required for edgeR analysis and output from the differential analysis, following the same pattern than for DEG analysis of RNAseq:
results/clusters/<analysis_name>__<ref_genome>__on_new_clusters/counts_for_edgeR.txt # Count data for edgeR analysis
results/clusters/<analysis_name>__<ref_genome>__on_new_clusters/samples_for_edgeR.txt # Table of samples information for edgeR analysis
results/clusters/<analysis_name>__<ref_genome>__on_new_clusters/FC_<line_sample1>__<tissue_sample1>_vs_<line_sample2>__<tissue_sample2>.txt # log Fold Change between each pairs of samples at all clusters
results/clusters/<analysis_name>__<ref_genome>__on_new_clusters/DEG_<line_sample1>__<tissue_sample1>_vs_<line_sample2>__<tissue_sample2>.txt # only differentially regulated clusters between each pair of samples
results/clusters/<analysis_name>__<ref_genome>__on_new_clusters/unique_DEGs.txt # list of clusters uniquely regulated in each sample
For each differential analysis (e.g. on new clusters), similar output than for RNAseq DEGs will be generated, following the naming pattern
sRNA_<analysis_name>_<ref_genome>__on_new_clusterspattern. It includes:results/sRNA/reports/summary_DEG_stats__<analysis_name>__<refgenome>__on_new_clusters.txt # number of differential regulated clusters in all pairwise comparisons and uniquely regulated in each sample results/combined/plots/BCV_RNAseq_<analysis_name>_<ref_genome>.pdf # Biological Coefficient of Variation of all genes results/combined/plots/MDS_RNAseq_<analysis_name>_<ref_genome>_<d12|d12_labs|d23|d23_labs>.pdf # Multidimensional scaling, all four versions results/combined/plots/Heatmap_sRNA_<cpm|zscore>__<analysis_name>__<ref_genome>__on_new_clusters.pdf # expression values accross all differentially regulated clusters by count per million and zscore
(See RNAseq for examples)
Upset Plot
Perfomed with ComplexUpset.
Table of combined clusters identified in at least one of the small RNA replicates in the analysis, split by chosen sizes:
results/combined/bedfiles/combined_clusters__sRNA__<analysis_name>__<ref_genome>.bed
Table of combined clusters annotated based on the closest gene:
results/combined/bedfiles/annotated__combined_clusters__sRNA__<analysis_name>__<ref_genome>.bed
Upset plot:
results/combined/plots/Upset_combined_clusters__sRNA__<analysis_name>__<ref_genome>.pdf
Example:
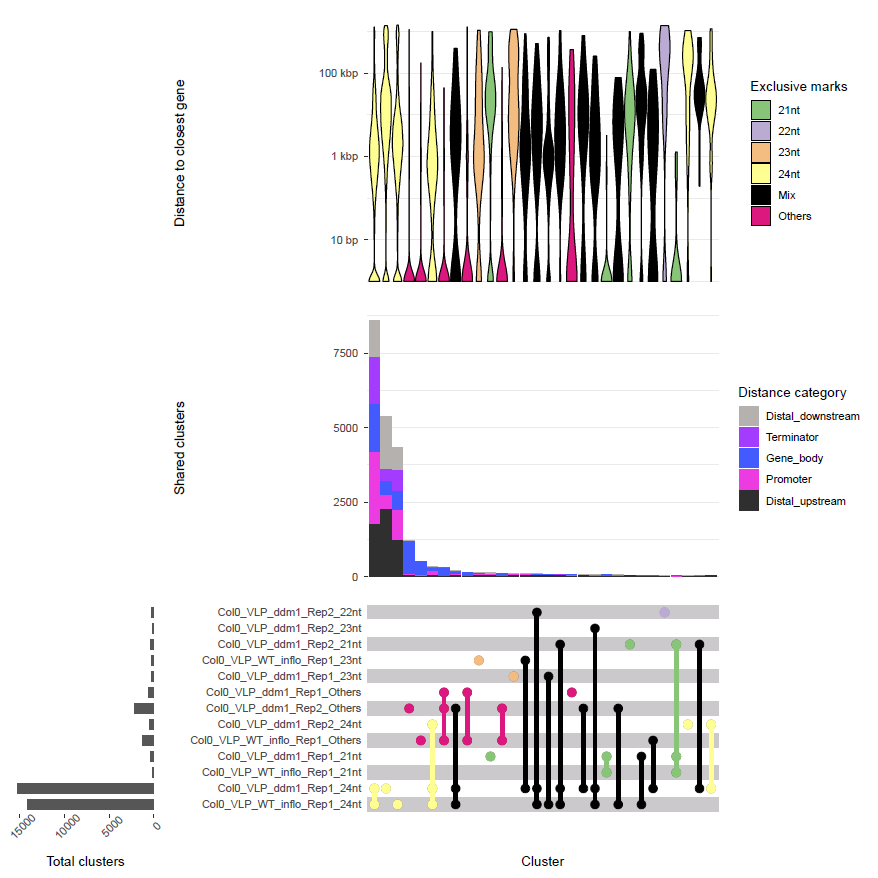
Upset plot of small RNA clusters
DNA methylation
Output tree
mC/
├── chkpts/     # Empty checkpoint files used for pipeline logic. Deleting them will trigger rerunning the corresponding analysis
├── DMRs/ # Differential Methylated Regions results. Contains list of DMRs for each context in pairwise comparisons and summary tables
├── fastq/      # Processed FASTQ files
├── logs/       # Log files
├── mapped/     # Mapped reads (bam)
├── methylcall/ # CX report (Bismark output) of methylation calls per cytosines
├── reports/    # QC reports (output from Cutadapt) and summary of mapping statistics and methylation statistics (output from Bismark)
└── tracks/     # Track files (bigwigs); strand-specific and merged methylation values (from 0 to 100%) for each replicate and all replicates of each sample merged
Mapping metrics
Data for each sample:
results/mC/reports/summary_mC_<paired>_mapping_stats_<data_type>__<line>__<tissue>__<sample_type>__<replicate>__<ref_genome>.txt
Summary table:
results/combined/reports/summary_mapping_stats_<analysis_name>_mC.txt
Plot:
results/combined/plots/mapping_stats_<analysis_name>_mC.pdf
(see histone ChIP-seq for an example)
Methylation Calls
Performed with Bismark
Methylation data for each sample:
results/mC/reports/final_report_<paired>__<data_type>__<line>__<tissue>__<sample_type>__<replicate>__<ref_genome>.html # html summary output from Bismark
results/mC/reports/<paired>__<data_type>__<line>__<tissue>__<sample_type>__<replicate>__<ref_genome>.deduplicated.cytosine_context_summary.txt # methylation level per sequence context output from Bismark
results/mC/reports/<paired>__<data_type>__<line>__<tissue>__<sample_type>__<replicate>__<ref_genome>.deduplicated.M-bias.txt # M-bias data output from Bismark
results/mC/reports/<paired>__<data_type>__<line>__<tissue>__<sample_type>__<replicate>__<ref_genome>.deduplicated_splitting_report.txt # Methylation extraction statistics output from Bismark
results/mC/methylcall/<data_type>__<line>__<tissue>__<sample_type>__<replicate>__<ref_genome>.deduplicated.CX_report.txt.gz # Table with methylation values and coverage for each cytosine of the genome
Differential Methylated Regions analysis
Performed with DMRcaller
List of differentially methylated regions (DMRs) in each sequence context and summary tables for each pairwise comparison of samples:
results/mC/DMRs/<data_type_sample1>__<line_sample1>__<tissue_sample1>__<sample_type_sample1>__<ref_genome_sample1>__vs__<data_type_sample2>__<line_sample2>__<tissue_sample2>__<sample_type_sample2>__<ref_genome_sample2>__CG_DMRs.txt # Bed file of DMRs in the CG context between sample1 and sample2 including methylation values and statistics (if there are any CG DMRs)
results/mC/DMRs/<data_type_sample1>__<line_sample1>__<tissue_sample1>__<sample_type_sample1>__<ref_genome_sample1>__vs__<data_type_sample2>__<line_sample2>__<tissue_sample2>__<sample_type_sample2>__<ref_genome_sample2>__CHG_DMRs.txt # Bed file of DMRs in the CHG context between sample1 and sample2 including methylation values and statistics (if mC context is all and there are any CHG DMRs)
results/mC/DMRs/<data_type_sample1>__<line_sample1>__<tissue_sample1>__<sample_type_sample1>__<ref_genome_sample1>__vs__<data_type_sample2>__<line_sample2>__<tissue_sample2>__<sample_type_sample2>__<ref_genome_sample2>__CHH_DMRs.txt # Bed file of DMRs in the CHH context between sample1 and sample2 including methylation values and statistics (if mC context is all and there are any CHH DMRs)

results/mC/DMRs/summary__<data_type_sample1>__<line_sample1>__<tissue_sample1>__<sample_type_sample1>__<ref_genome_sample1>__vs__<data_type_sample2>__<line_sample2>__<tissue_sample2>__<sample_type_sample2>__<ref_genome_sample2>__DMRs.txt # summary table with the number of Hyper- and Hypo-methylated regions in each sequence context between sample1 and sample2
Combined Output
Upset Plot
Perfomed with ComplexUpset.
Table of combined peaks for all TF and histone ChIP-seq samples in the analysis:
results/combined/bedfiles/combined_peaks__all_chip__<analysis_name>__<ref_genome>.bed
Table of combined peaks for all TF and histone ChIP-seq samples in the analysis annotated based on the closest gene:
results/combined/bedfiles/annotated__combined_peaks__all_chip__<analysis_name>__<ref_genome>.bed
Upset plot:
results/combined/plots/Upset_combined_peaks__all_chip__<analysis_name>__<ref_genome>.pdf
Example:
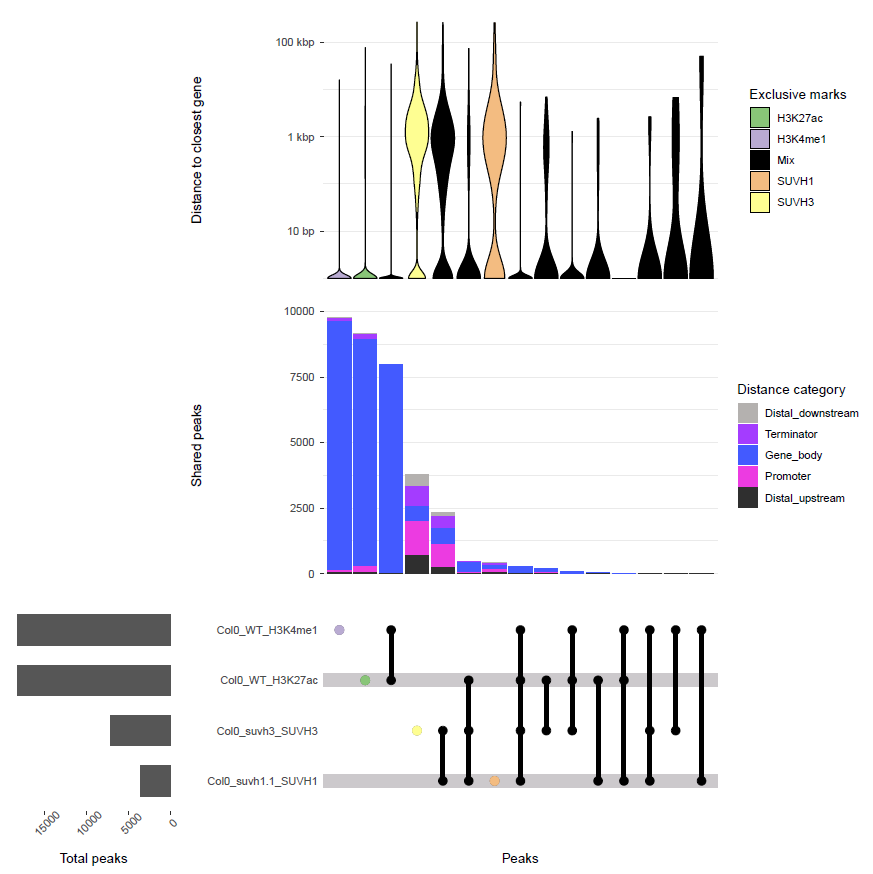
Upset plot of peaks in all histone and TF ChIP-seq samples
Heatmaps and metaplots
Performed with Deeptools.
Heatmaps and metaplots will be performed on all genes in the reference genome, and on all TEs in the TE file provided if optional TE analysis is selected.
Three sets of heatmaps and metaplots will be generated with a corresponding prefix, aligning all regions on their Transcription Start Sites (tss), Transcription End sites (tes) and scaling all regions to the same lenght (regions) (used for examples below).
DNA methylation samples are treated separately for these outputs due to different interpolation method requirement for vizualization (‘nearest’ instead of ‘bilinear’ for the other data types).
Deeptool matrices and sorted region files:
results/combined/matrix/final_matrix_regions__most__<analysis_name>__<ref_genome>__all_genes.gz # matrix scaled by regions for all samples except mC on all genes
results/combined/matrix/final_matrix_regions__mC__<analysis_name>__<ref_genome>__all_genes.gz # matrix scaled by regions for mC samples on all genes
results/combined/matrix/sorted_final_matrix_regions__mC__<analysis_name>__<ref_genome>__all_genes.gz # matrix scaled by regions for mC samples on all genes sorted according to other samples (only present if `heatmap_sort_mc_after_others` is set to `true`)
results/combined/matrix/Heatmap__regions__most__<analysis_name>__<ref_genome>__all_genes_sorted_regions.bed # bed-file of regions of all genes in sorted order of all samples except mC

results/combined/matrix/final_matrix_tss__most__<analysis_name>__<ref_genome>__all_genes.gz # matrix of regions aligned on TSS for all samples except mC on all genes
results/combined/matrix/final_matrix_tss__mC__<analysis_name>__<ref_genome>__all_genes.gz # matrix of regions aligned on TSS for mC samples on all genes
results/combined/matrix/sorted_final_matrix_tss__mC__<analysis_name>__<ref_genome>__all_genes.gz # matrix of regions aligned on TSS for mC samples on all genes sorted according to other samples (only present if `heatmap_sort_mc_after_others` is set to `true`)
results/combined/matrix/Heatmap__tss__most__<analysis_name>__<ref_genome>__all_genes_sorted_regions.bed # bed-file of regions aligned on TSS of all genes in sorted order of all samples except mC

results/combined/matrix/final_matrix_tes__most__<analysis_name>__<ref_genome>__all_genes.gz # matrix of regions aligned on TES for all samples except mC on all genes
results/combined/matrix/final_matrix_tes__mC__<analysis_name>__<ref_genome>__all_genes.gz # matrix of regions aligned on TES for mC samples on all genes
results/combined/matrix/sorted_final_matrix_tes__mC__<analysis_name>__<ref_genome>__all_genes.gz # matrix of regions aligned on TES for mC samples on all genes sorted according to other samples (only present if `heatmap_sort_mc_after_others` is set to `true`)
results/combined/matrix/Heatmap__tes__most__<analysis_name>__<ref_genome>__all_genes_sorted_regions.bed # bed-file of regions aligned on TES of all genes in sorted order of all samples except mC

#optional: if TE analysis is set to true, the same files will be generated for all regions in the provided TE file
Heatmaps:
results/combined/plots/Heatmap__regions__most__<analysis_name>__<ref_genome>__all_genes.pdf # heatmaps scaled by regions of all samples except mC, sorted by mean (default, can be changed in configuration)
results/combined/plots/Heatmap_sorted__regions__mC__<analysis_name>__<ref_genome>__all_genes.pdf # heatmaps scaled by regions of mC samples, in the same sort order than all other samples above (if `heatmap_sort_mc_after_others` is set to `true`)
results/combined/plots/Heatmap__regions__mC__<analysis_name>__<ref_genome>__all_genes.pdf # heatmaps scaled by regions of mC samples, sorted by mean (default, can be changed in configuration if `heatmap_sort_mc_after_others` is set to `false`)

results/combined/plots/Heatmap__tss__most__<analysis_name>__<ref_genome>__all_genes.pdf # heatmaps of regions aligned on TSS of all samples except mC, sorted by mean (default, can be changed in configuration)
results/combined/plots/Heatmap_sorted__tss__mC__<analysis_name>__<ref_genome>__all_genes.pdf # heatmaps of regions aligned on TSS of mC samples, in the same sort order than all other samples above (if `heatmap_sort_mc_after_others` is set to `true`)
results/combined/plots/Heatmap__tss__mC__<analysis_name>__<ref_genome>__all_genes.pdf # heatmaps of regions aligned on TSS of mC samples, sorted by mean (default, can be changed in configuration if `heatmap_sort_mc_after_others` is set to `false`)

results/combined/plots/Heatmap__tes__most__<analysis_name>__<ref_genome>__all_genes.pdf # heatmaps of regions aligned on TSS of all samples except mC, sorted by mean of all these samples (default, can be changed in configuration)
results/combined/plots/Heatmap_sorted__tes__mC__<analysis_name>__<ref_genome>__all_genes.pdf # heatmaps of regions aligned on TSS of mC samples, in the same sort order than all other samples above (if `heatmap_sort_mc_after_others` is set to `true`)
results/combined/plots/Heatmap__tes__mC__<analysis_name>__<ref_genome>__all_genes.pdf # heatmaps of regions aligned on TSS of mC samples, sorted by mean of all these mC samples (if `heatmap_sort_mc_after_others` is set to `false`)

#optional: if TE analysis is set to true, the same files will be generated for all regions in the provided TE file
Examples:
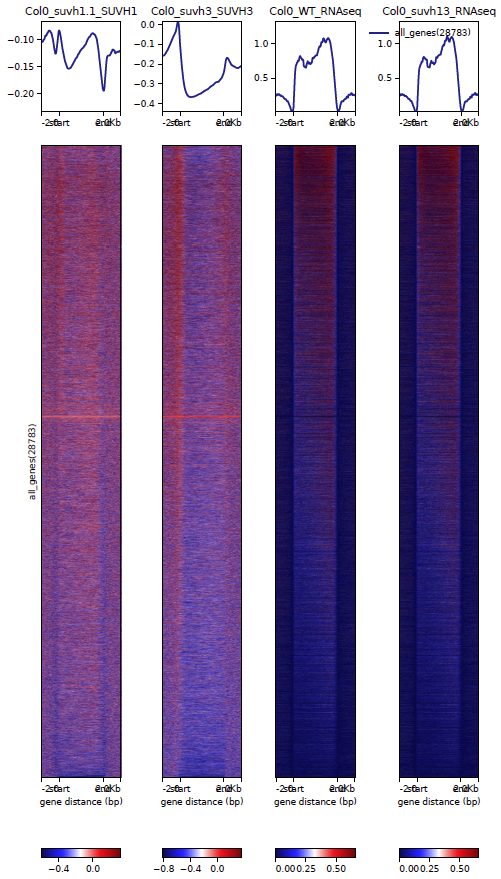
Heatmap of scaled regions for all samples but mC at all genes
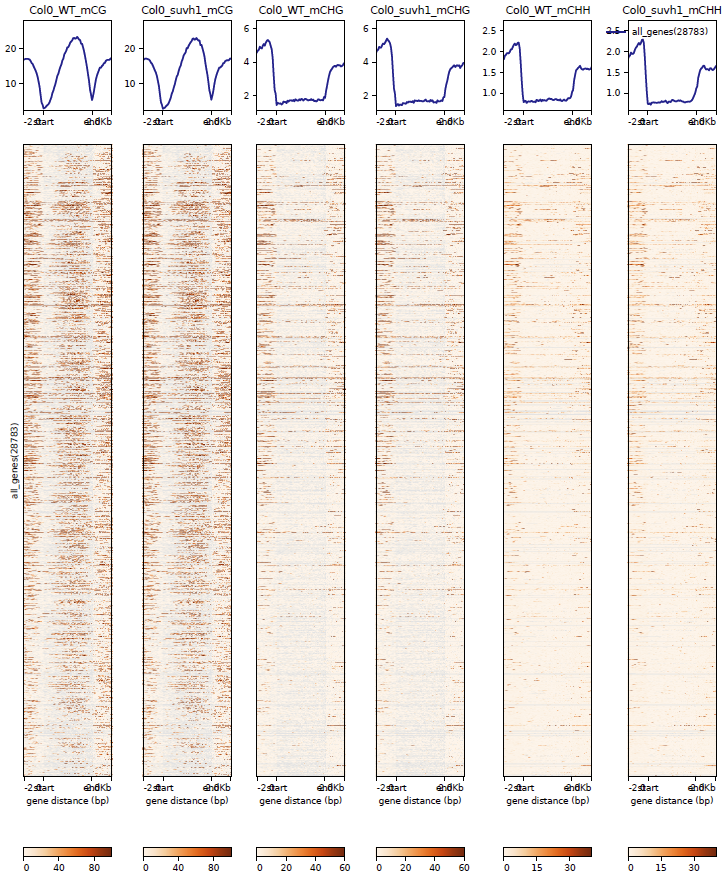
Heatmap of scaled regions for mC samples at all genes in the same sorted order than above
Metaplots:
results/combined/plots/Profile__regions__most__<analysis_name>__<ref_genome>__all_genes.pdf # Metaplots of mean using lines (defaults, can be changed in configuration) scaled by regions of all samples except mC on all genes (each sample on its own plot).
results/combined/plots/Profile_pergroup__regions__most__<analysis_name>__<ref_genome>__all_genes.pdf # Metaplots of mean using lines (defaults, can be changed in configuration) scaled by regions of all samples except mC on all genes (all samples on the same plot, can get messy).
results/combined/plots/Profile__regions__mC__<analysis_name>__<ref_genome>__all_genes.pdf # Metaplots of mean using lines (defaults, can be changed in configuration) scaled by regions of mC samples on all genes (each sample on its own plot).
results/combined/plots/Profile_pergroup__regions__mC__<analysis_name>__<ref_genome>__all_genes.pdf # Metaplots of mean using lines (defaults, can be changed in configuration) scaled by regions of mC samples on all genes (all samples on the same plot, can get messy).

results/combined/plots/Profile__tss__most__<analysis_name>__<ref_genome>__all_genes.pdf # Metaplots of mean using lines (defaults, can be changed in configuration) aligned on TSS of all samples except mC on all genes (each sample on its own plot).
results/combined/plots/Profile_pergroup__tss__most__<analysis_name>__<ref_genome>__all_genes.pdf # Metaplots of mean using lines (defaults, can be changed in configuration) aligned on TSS of all samples except mC on all genes (all samples on the same plot, can get messy).
results/combined/plots/Profile__tss__mC__<analysis_name>__<ref_genome>__all_genes.pdf # Metaplots of mean using lines (defaults, can be changed in configuration) aligned on TSS of mC samples on all genes (each sample on its own plot).
results/combined/plots/Profile_pergroup__tss__mC__<analysis_name>__<ref_genome>__all_genes.pdf # Metaplots of mean using lines (defaults, can be changed in configuration) aligned on TSS of mC samples on all genes (all samples on the same plot, can get messy).

results/combined/plots/Profile__tes__most__<analysis_name>__<ref_genome>__all_genes.pdf # Metaplots of mean using lines (defaults, can be changed in configuration) aligned on TES of all samples except mC on all genes (each sample on its own plot).
results/combined/plots/Profile_pergroup__tes__most__<analysis_name>__<ref_genome>__all_genes.pdf # Metaplots of mean using lines (defaults, can be changed in configuration) aligned on TES of all samples except mC on all genes (all samples on the same plot, can get messy).
results/combined/plots/Profile__tes__mC__<analysis_name>__<ref_genome>__all_genes.pdf # Metaplots of mean using lines (defaults, can be changed in configuration) aligned on TES of mC samples on all genes (each sample on its own plot).
results/combined/plots/Profile_pergroup__tes__mC__<analysis_name>__<ref_genome>__all_genes.pdf # Metaplots of mean using lines (defaults, can be changed in configuration) aligned on TES of mC samples on all genes (all samples on the same plot, can get messy).

#optional: if TE analysis is set to true, the same files will be generated for all regions in the provided TE file
Examples:
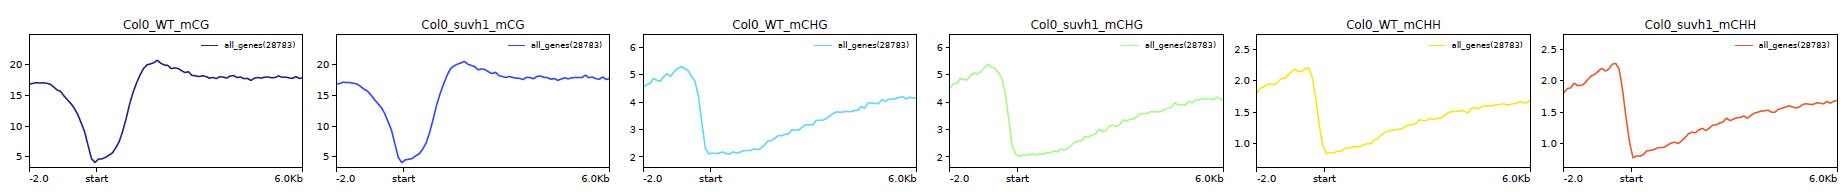
Metaplot of all genes aligned on their TSS for mC samples
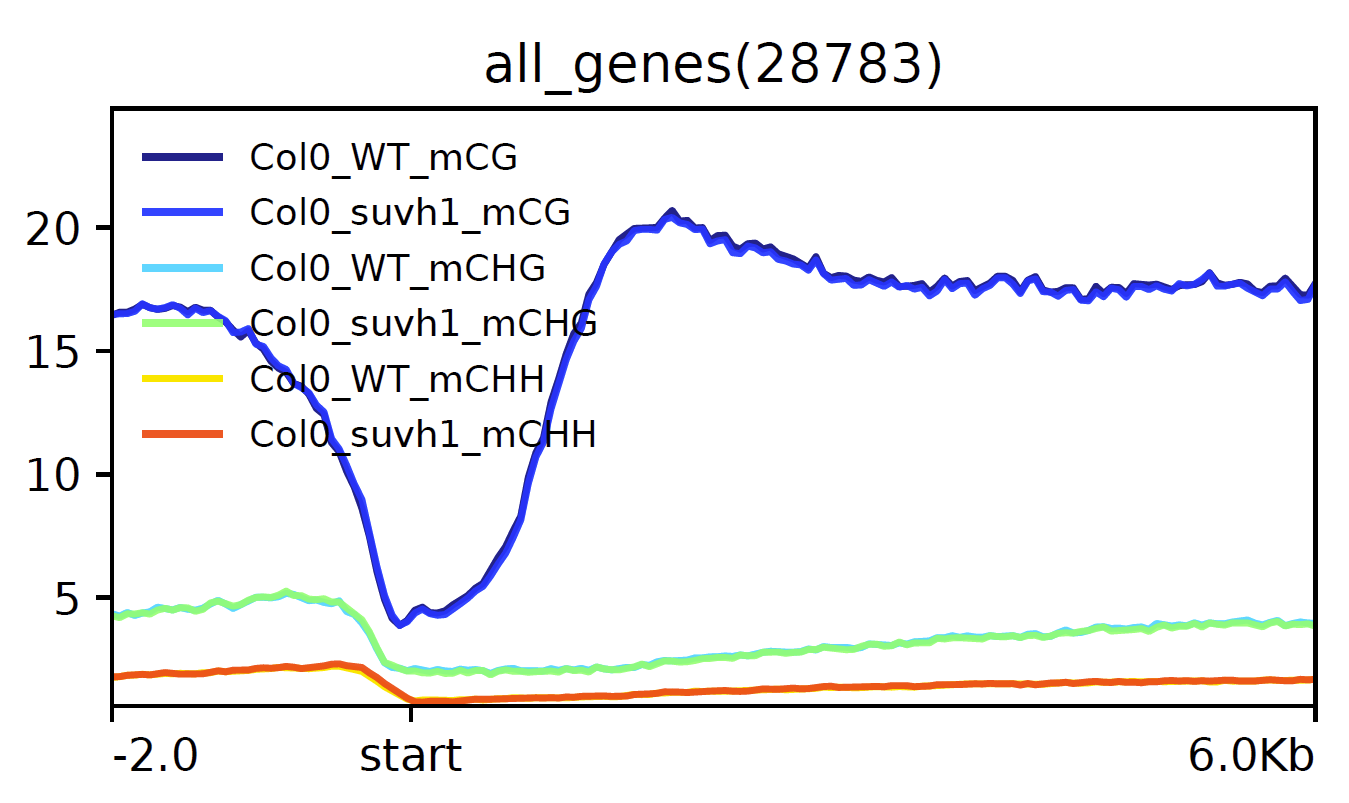
Metaplot of all genes aligned on their TSS for mC samples on the same plot
(the actual outputs are in pdf format)
Browser screenshots
Performed with Gviz.
Browser shot over whole chromosomes:
results/combined/plots/Browser_full_chromosomes__all__epicc__ColCEN.pdf # Browser of all the samples on full-length chromsomes
Example:
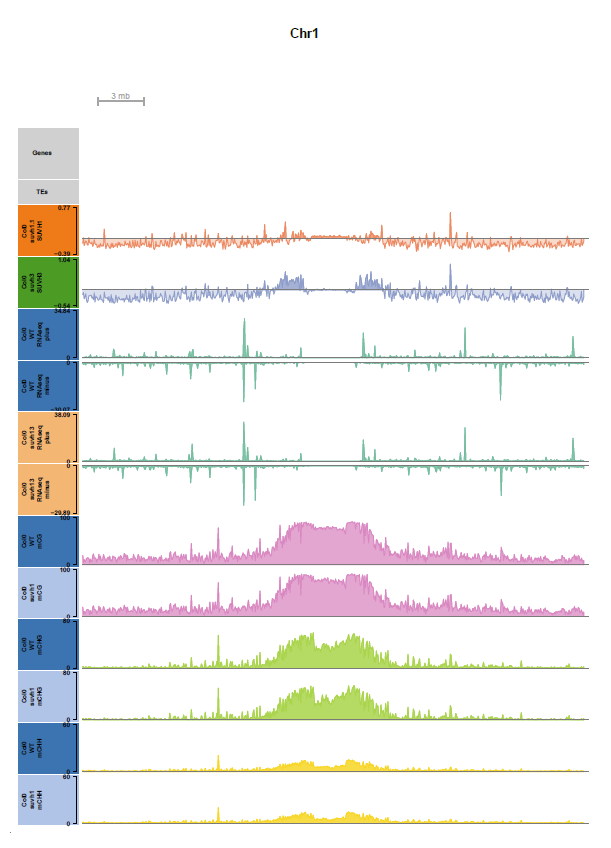
Browser shot of full-length chromosome1 (binsize 50kb)
Browser shot over target regions:
results/combined/plots/Browser_interesting_genes__all__epicc__ColCEN.pdf # Browser of all the samples at the target loci `data/target_loci.bed`
Example:
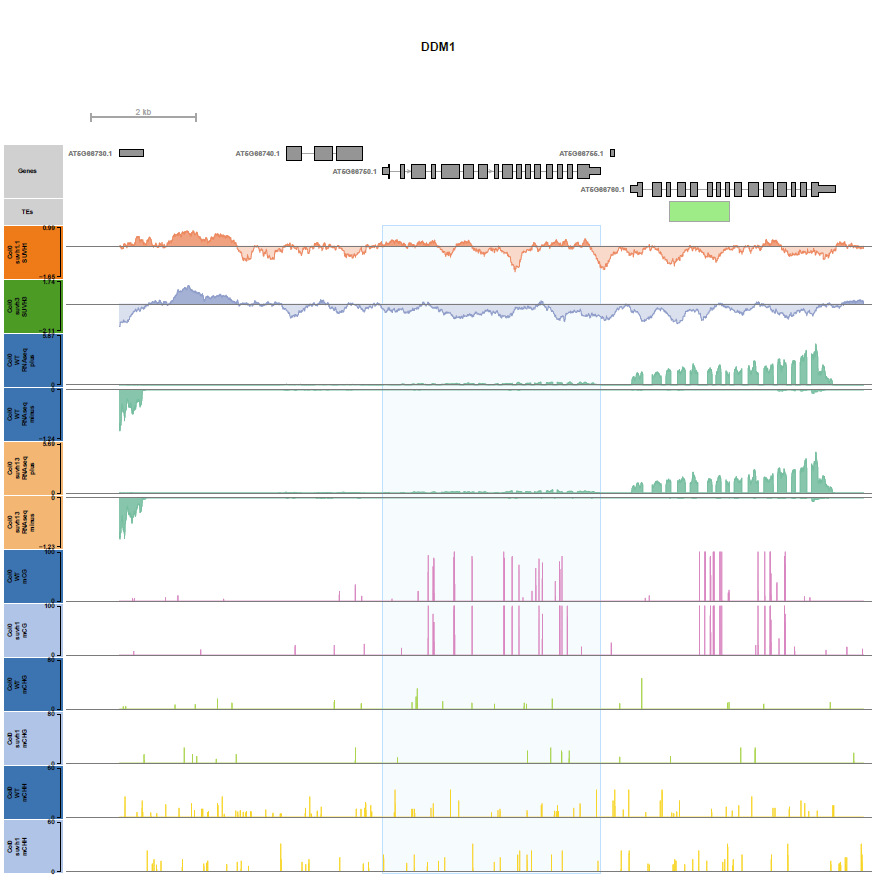
Browser shot around a target loci, here the region surrounding the DDM1 gene (binsize 1bp)
(the actual output is in pdf format)